Case study · 14 / 14
Trần Huy Vũ
Trần Huy Vũ is a data and systems consultant who builds dashboards, ETL pipelines and analytical models for companies, and teaches data analysis.
01Challenge
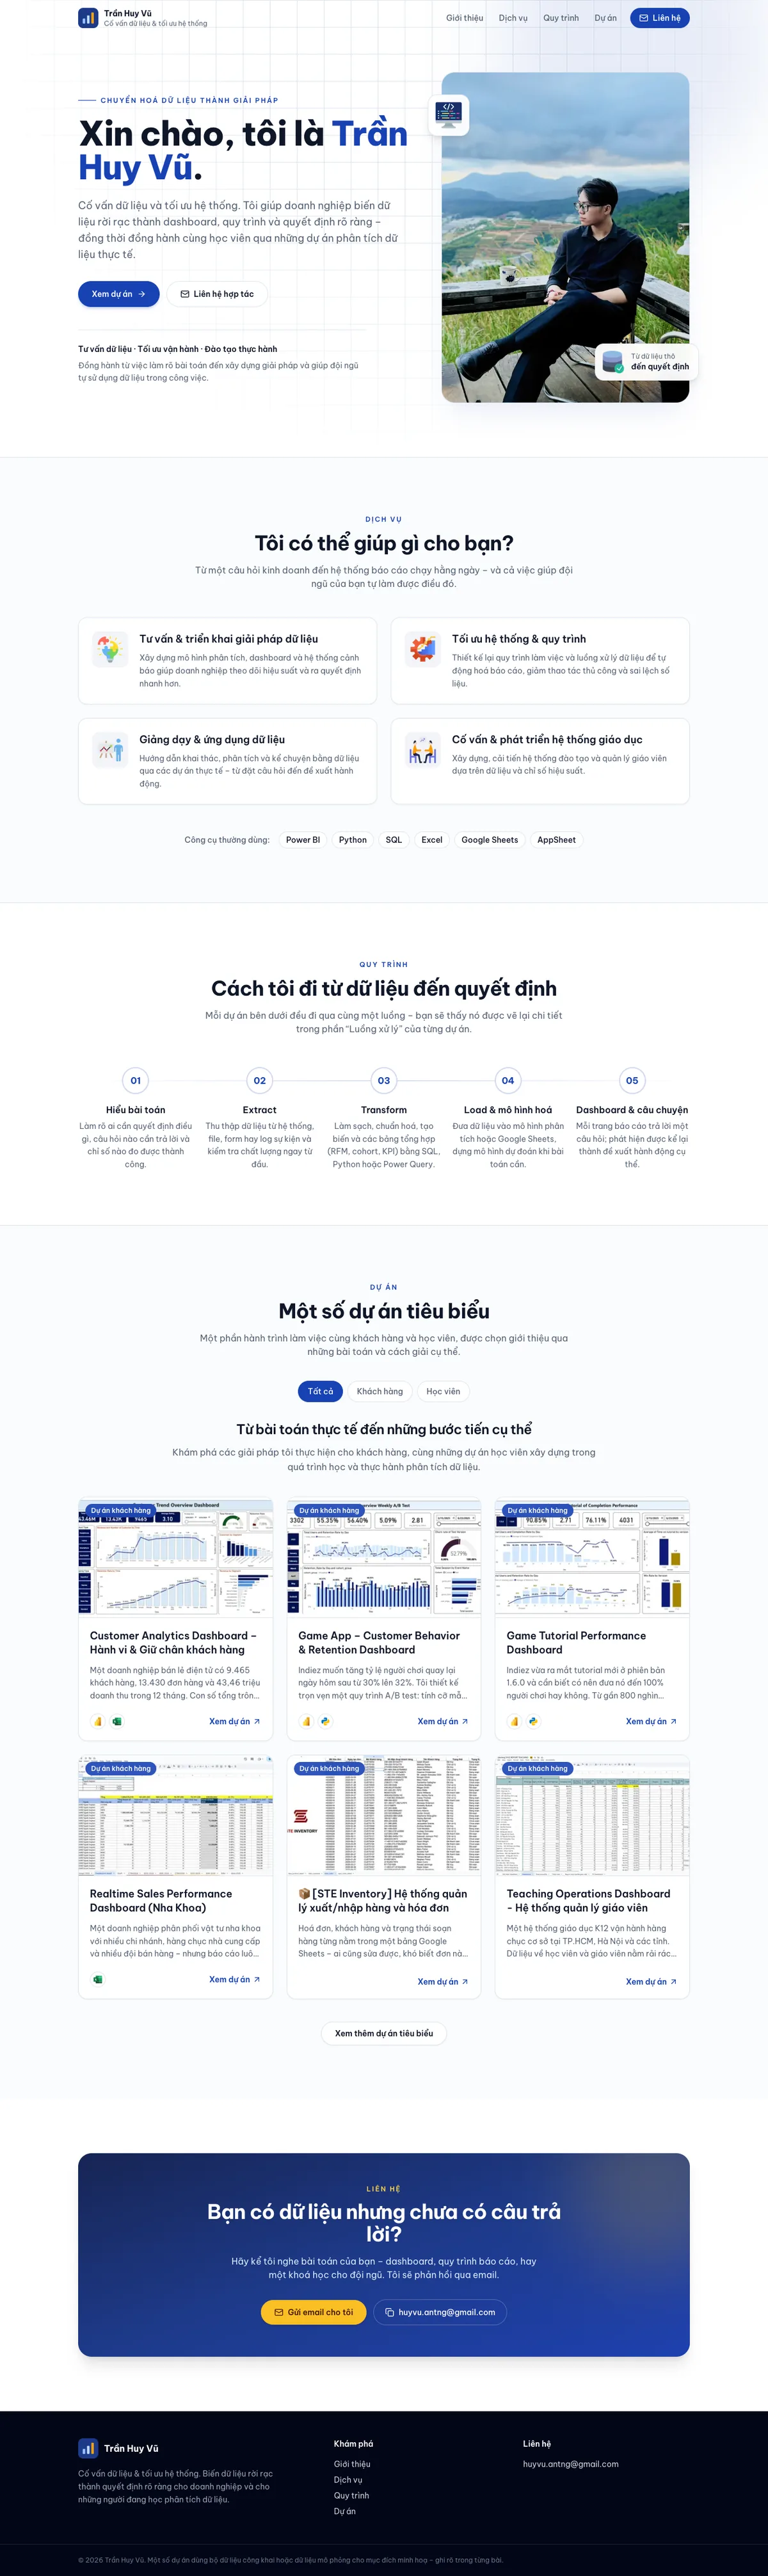
A data consultant needed to present both his services for companies and his projects with students, and show how he goes from raw data to a decision.
02Solution
A Next.js site with services, a five-step process and a project list filtered by client or student work; each project has its own page with a live dashboard, the processing flow and the data story.
03Key features
- Four service areas and the tools he uses: Power BI, Python, SQL, Excel, Google Sheets, AppSheet
- A five-step process: understand the problem, Extract, Transform, Load & model, Dashboard & story
- Project list filtered by client or student work
- Project pages: live dashboard, processing flow, data story and documents
04Delivered scope
13projects with their own pageCounted on tranhuyvu.stedata.com.vn
5steps in the working processCounted on tranhuyvu.stedata.com.vn
Counted on the delivered website and the acceptance record.
05Scope & technology
Next.jsPersonal websiteProject pages & filterResponsive layout